Earthquake sequence between Santorini Amorgos Islands since January the 27th 2025
Last update: 27 March 2025 at 08:56 UTC
Updated version (2025/03/25): Report from the Institute of Geodynamics, National Observatory of Athens (NOAIG): Observations and Preliminary results on the seismic sequence between Santorini and Amorgos
Preliminary report from Ioanna Triantafyllou & Gerassimos A. Papadopoulos, H: A unique seismic cluster near Santorini, Greece, foreshadows a strong earthquake?
Report from P. Briole : updated note on ground deformation at Santorin with a preliminary calculation of the volume of magma that might be involved in the ongoing seismo-volcanic crisis
Preliminary report on Santorini InSAR Analysis (Dr. Athanassios Ganas and Dr Varvara Tsironi): 2024-2025 Deformation of the Santorini Caldera: InSAR time-series data from the S1A satellite of the European Space Agency
Preliminary report on Santorini (Softa et al.): Santorini Island (Northeast of Aegean Sea) 1-7 February 2025 Earthquake Activity Preliminary Assessment Report-1
Report for Santorini Amorgos sequence (J. Zahradník, E. Sokos, Z. Roumelioti, F. Turhan): Positive isotropic components of the 2025 Santorini-Amorgos earthquake
Santorini-Amorgos seismic crisis explained by french scientists : https://youtu.be/VqfDUZv8Qx0?feature=shared
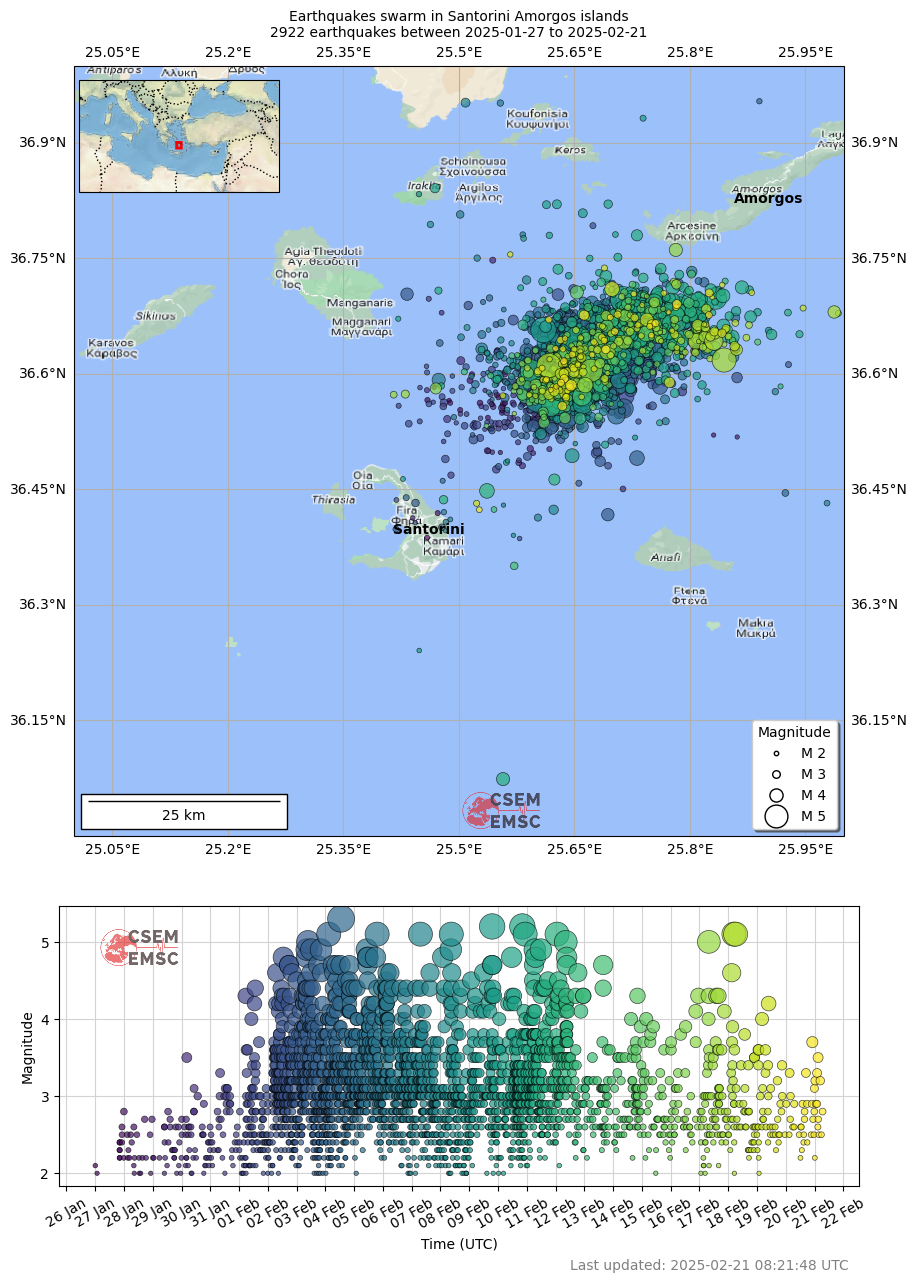
A major seismic crisis has been affecting the Santorini-Amorgos region since 27 January. To date, more than two thousand earthquakes with magnitudes up to 5.3 have been recorded and 14 earthquakes have a magnitudes greater or equal to 5.0. These earthquakes are concentrated about 25 kilometers northeast of Santorini and 25 kilometers southwest of Amorgos islands. Since February 12th, the seismicity has decreased as shown in the Figure 4.
More than 10,000 residents and tourists have been evacuated from the island of Santorini.
We understand that this is not an easy situation for the people of the region, so please listen to the Greek authorities and be aware that, as usual, many people are making nosense statements on social media. Stay safe.
If you felt these earthquakes, please share your experience with us. Your testimony will be useful to update the Intensity map here below, where the felt intensities represent the effects of the earthquake over the impacted area
Fascinating post on bluesky by Jannes Münchmeyer showing the Santorini sequence migrating backwards and forwards along a linear channel at a velocity of 2km/h: https://bsky.app/profile/did:plc:tdipym5ldswlcm65zkldzhed/post/3lhtahrv4f22l
Here is another animation of the Santorini-Amorgos swarm by Marius Isken using pyrocko's Sparrow on X: https://x.com/seismolicious/status/1889727179631518116
 |
|
| Figure 1: Spatial and temporal distribution of the seismic activity between the islands of Santorini and Amorgos. Purple dots represent the oldest earthquakes in the series, while yellow dots represent the most recent earthquakes. The size of each dot is related to the magnitude of the earthquake. | Figure 2: Animation of the spatial and temporal distribution of the seismic activity between the islands of Santorini and Amorgos. Purple dots represent the oldest earthquakes in the series, while yellow dots represent the most recent earthquakes. The size of each dot is related to the magnitude of earthquakes. The map shows earthquakes in a 12-hour moving window. |
 |
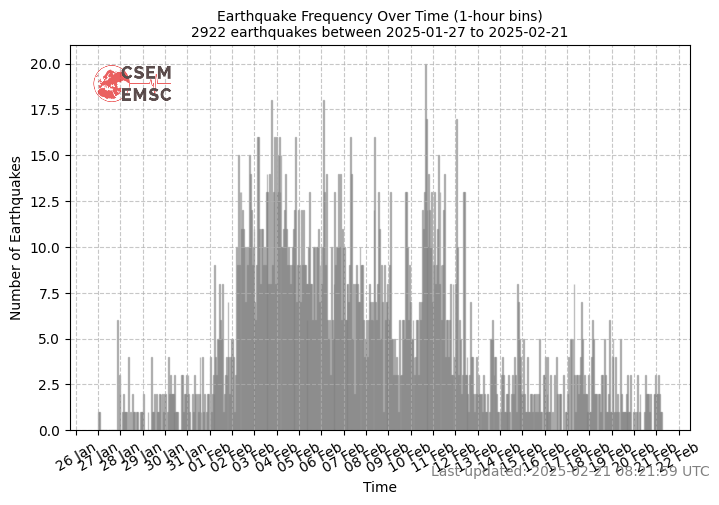 |
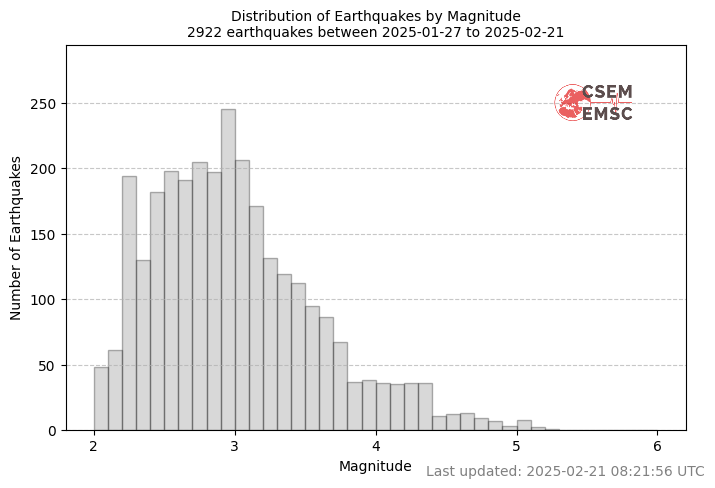
| Figure 3: Distribution of earthquakes by magnitude where Vertical bars represent the number of earthquakes inside each 0.1 magnitude interval. | Figure 4: Evolution of the seismicity over time since the start of the Santorini-Amorgos seismic crisis. Each bar represent the number of earthquake by hour. |
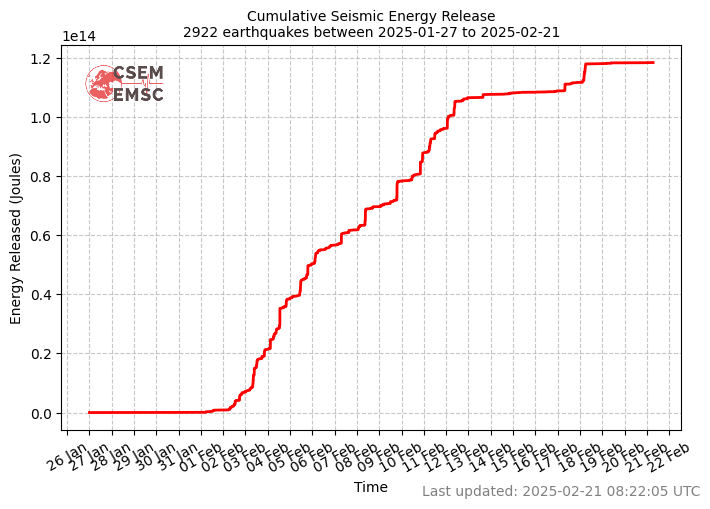 |
| Figure 5: Cumulative seismic energy released during the Santorini-Amorgos seismic swarm. |
 |
 |
|
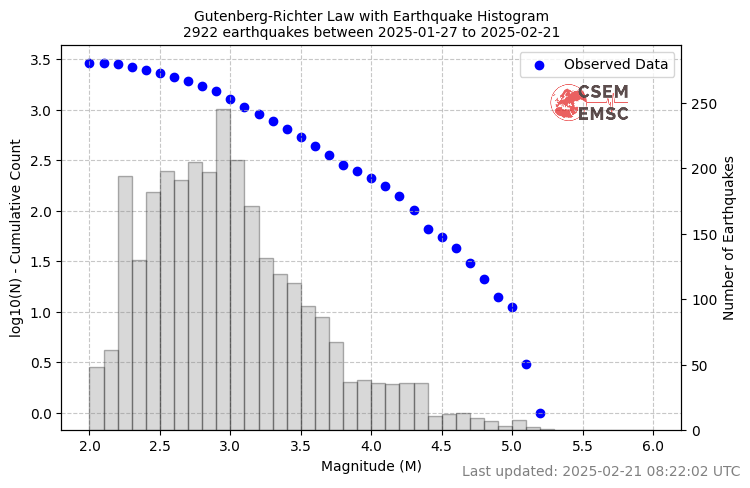
Figure 6: Gutenberg-Richter law for Santorini-Amorgos seismic swarm. Vertical bars represent the number of earthquakes inside each 0.1 magnitude interval, dots are the cumulative number of earthquakes above a certain magnitude value. |
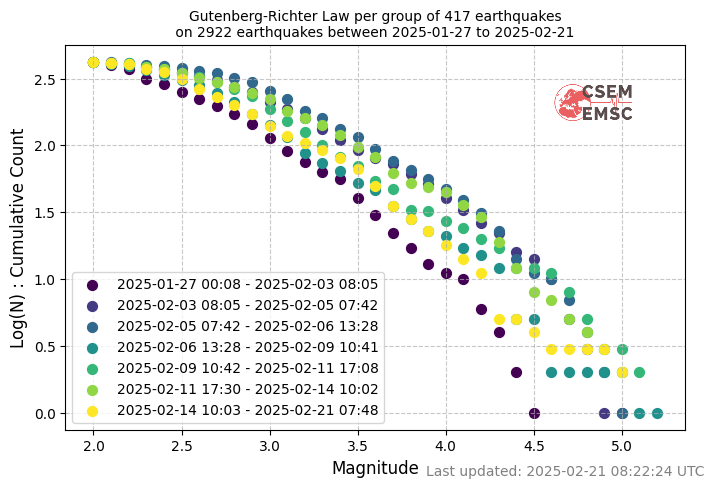
Figure 7: Gutenberg-Richter law for Santorini-Amorgos seismic swarm for different time range. |
 |
 |
|
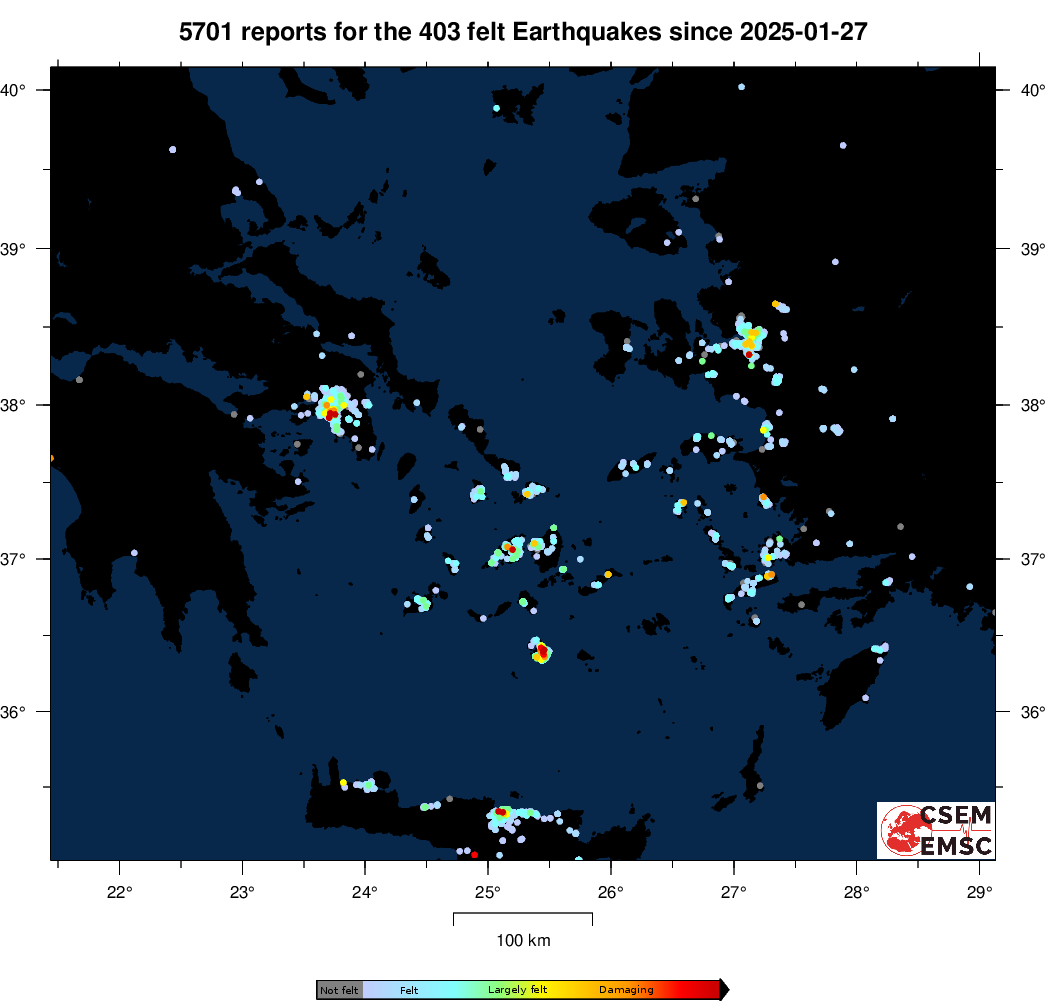
Figure 8: Spatial distribution of felt reports collected on the EMSC platform since 27 January, 2025. A total of 5,759 felt reports were collected for 416 earthquakes between the islands of Santorini and Amorgos. Intensity is scaled from weakly felt (light blue) to strongly felt (red). |
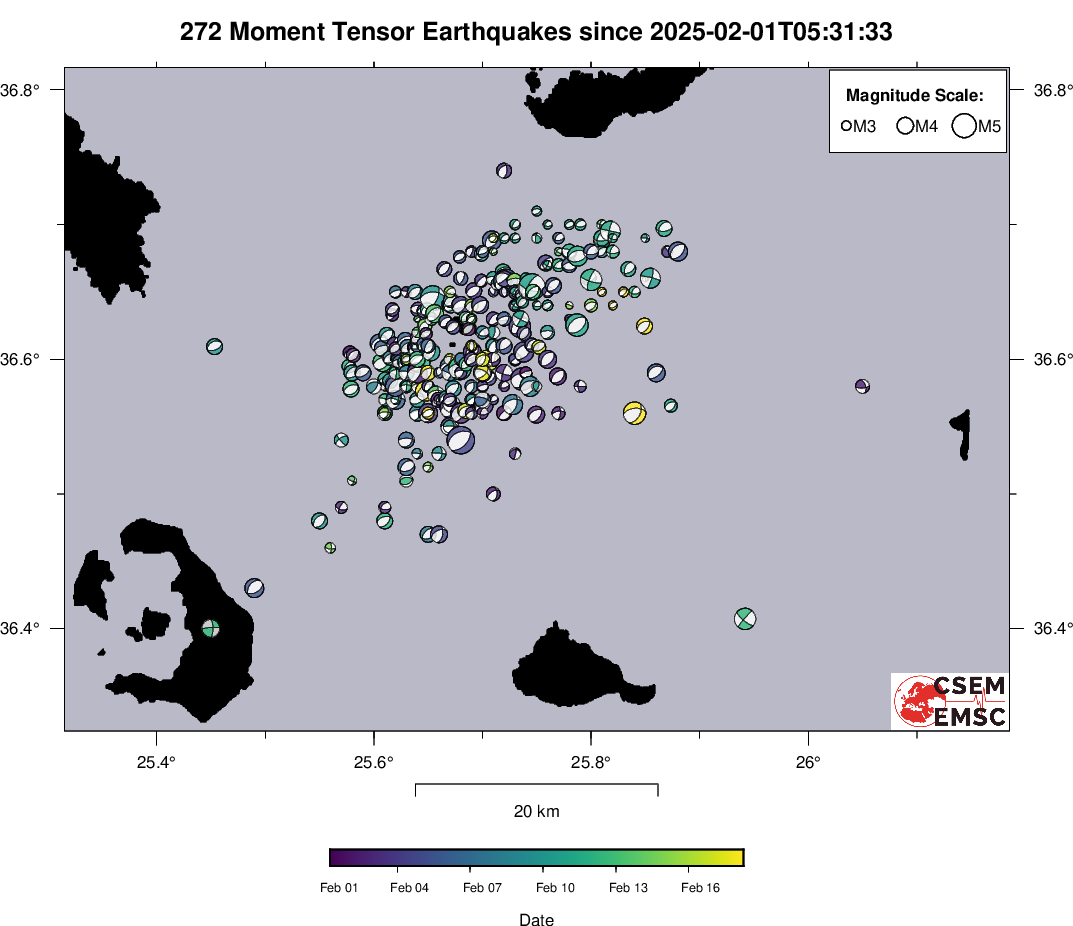
Figure 9: Moment tensor solutions for the Santorini-Amorgos seismic crisis. Moment tensor are calculated by USGS, NOA, OCA, GFZ. |
Did you feel the earthquake and take photos or videos of its effects (on buildings, ground, landscape)? Share your testimony with us using this link.